Inventory Variance
Reports > Inventory > Inventory Variance
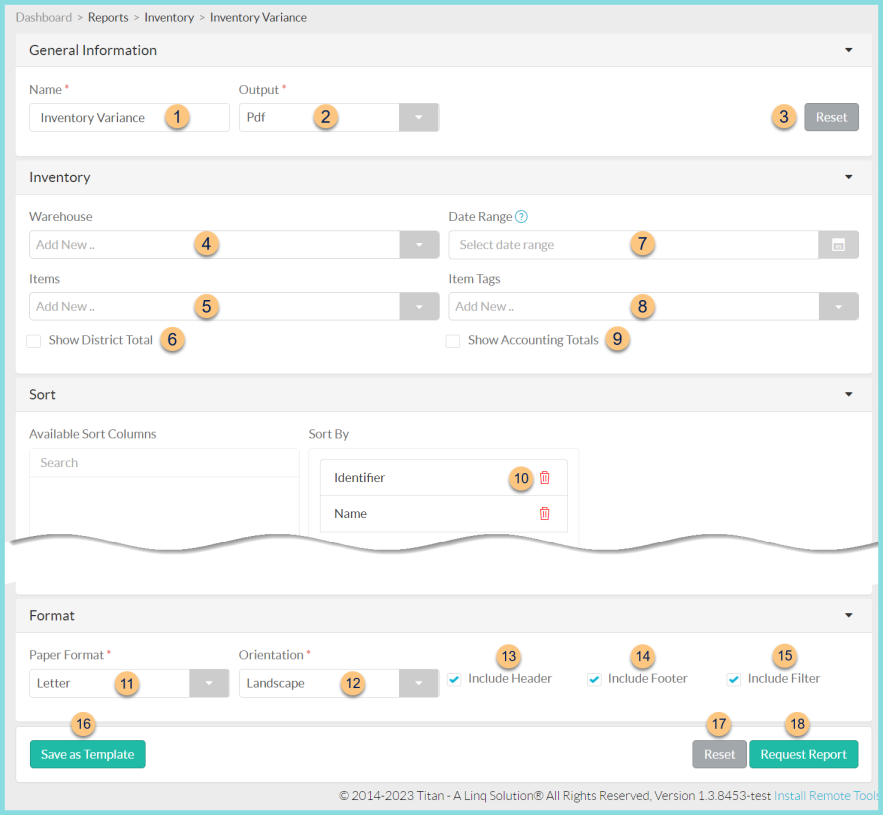
The Inventory Variance Report displays changes in inventory per item over a selected date range.
-
Name - enter a report name
Default: Inventory Variance -
Output - select output format (Html, Pdf (default))
Template (not pictured) - select a report template -
Reset - click to reset to default options
-
Warehouse - filter by warehouse
-
Items - filter by inventoried item(s)
-
Show District Total - check to include a page of variances for the district as a whole
-
Date Range - filter by date range
-
Item Tags - filter by item tag(s)
-
Show Accounting Totals - check to include sums for each account code
Group by Inventory Category (Financial System Integrations only) - check to include inventory category groupings -
Sort - click the (+) icon to sort by Identifier or Name
-
Paper Format - choose a paper format (CR80, Legal, Letter (default))
-
Orientation - choose orientation (Landscape (default), Portrait)
-
Include Header - check to include report header
-
Include Footer - check to include report footer
-
Include Filter - check to include selected filters
-
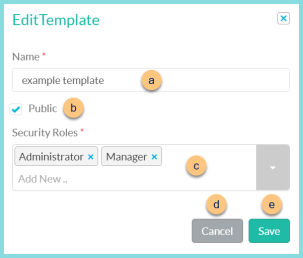
Save as Template - click to save the selected filters and columns as a template
-
Name - enter a template name
-
Public - check to make the template available to other users
-
Security Roles - select the security roles that can access a Public template
-
Cancel - click to return to the previous screen without saving the template
-
Save - click to save the template
-
Reset - click to reset to defaults
-
Request Report - click to request report
Note: Report will appear in the bell icon when complete
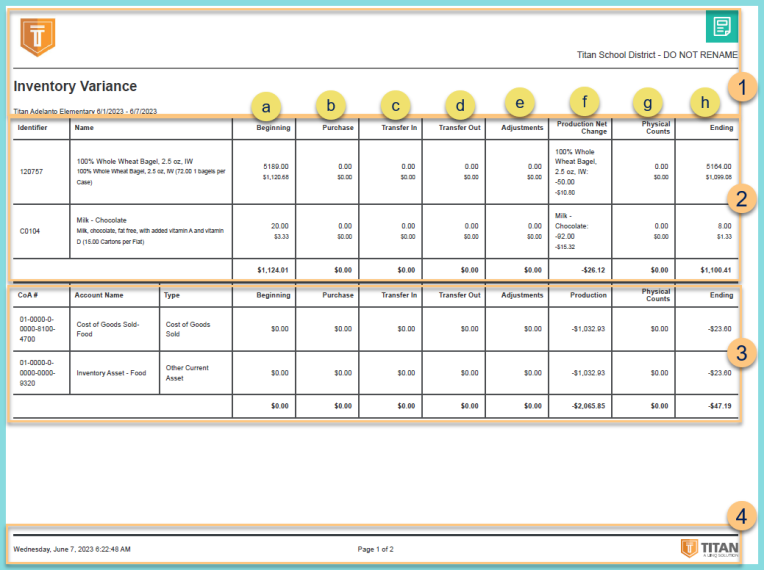
Report Format
-
Header - notice the District Logo, Report Title, Warehouse Name, Date Range, and District Name.
-
Variance - notice one row per item with the identifier, item name, description, and base units per preferred unit of measure. For each item, notice the reasons for change, the quantity, and value. Notice the total dollar value for each change type.
-
Beginning - notice the on hand quantity as of the first day of the date range
-
Purchase - notice the quantity received from vendors during the date range
-
Transfer In - notice the quantity received from other warehouses during the date range
-
Transfer Out - notice the quantity fulfilled to other warehouses during the date range
-
Adjustments - notice the net quantity adjusted during the date range
-
Production - notice the net quantity changed due to production during the date range
-
Physical Counts - notice the net change in quantity due to physical counts during the date range
-
Ending - notice the on hand quantity as of the last day of the date range
-
Chart of Accounts - notice one row per account with the account number and name and total value(s) of above categories
-
Footer - notice the date and time the report was requested, pages, and TITAN logo